 HoodRadar
borough · Montreal
Living in Anjou: safety, housing and rent context
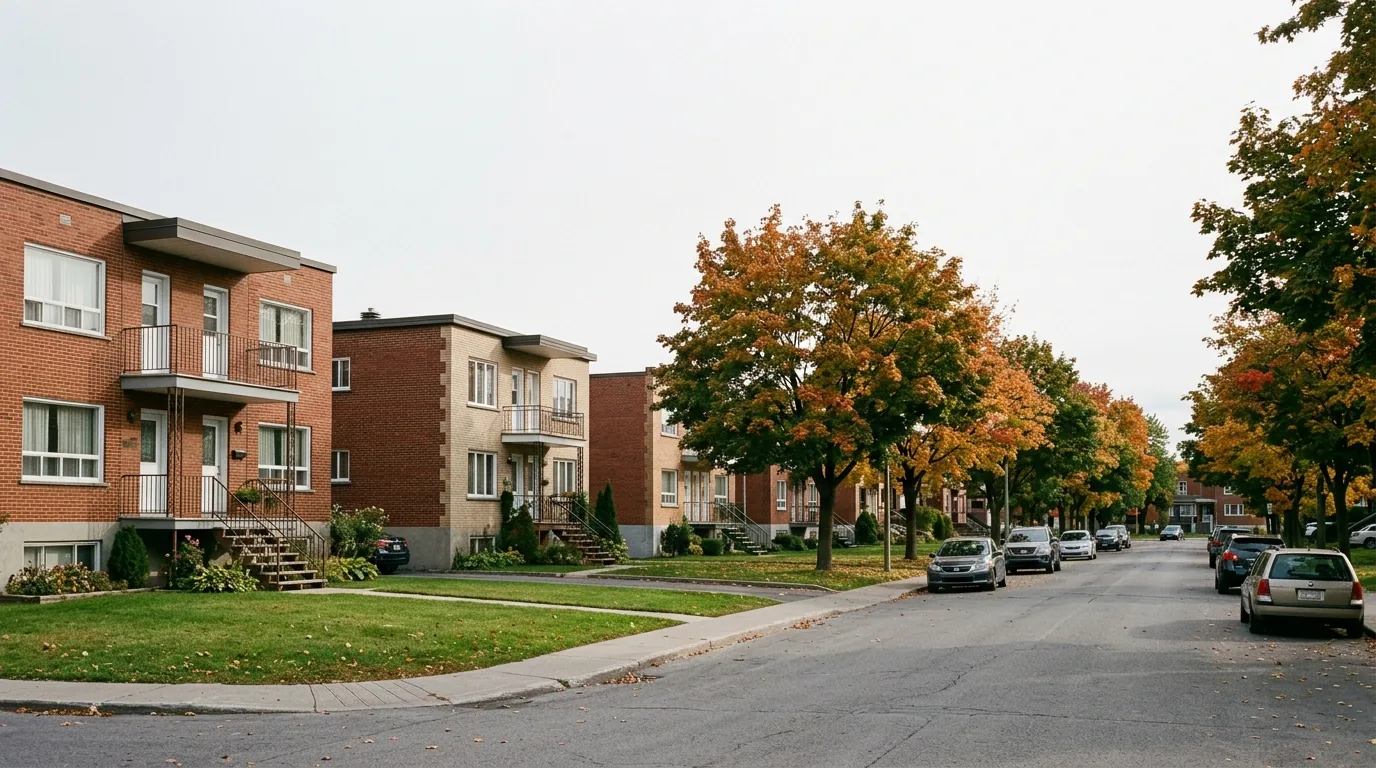
Crime in Anjou sits close to the city average, at 22.4 located acts relative to the number of dwellings, against 23.6 across the city. Break-ins are the exception to the calm picture: fewer than the city norm at 4.2, but moving upward. The housing stock, 20,606 units on the assessment roll, is dominated by post-war construction with a median build year of 1969.
Crime and safety
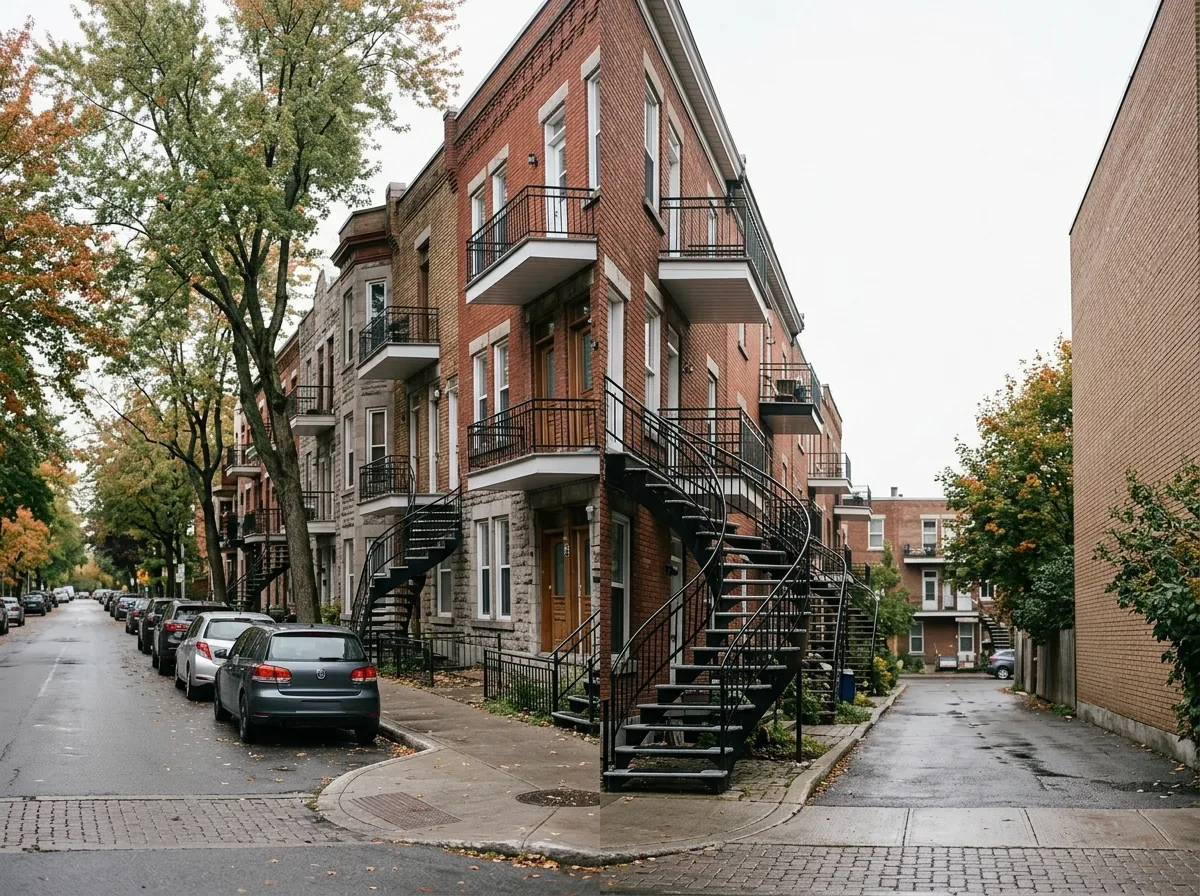
Police recorded 462 located criminal acts in Anjou over the most recent full year of data, down from 480 in the preceding period, a change of -3.8%. That puts the borough at rank 13 among Montréal boroughs ordered from the lowest rate upward, and the year-over-year picture is stable.
Vehicle-related offences shape the local profile: vehicle thefts make up 27.3% of located acts, a larger slice than any other category. Residential break-ins numbered 87, which works out to 4.2 relative to the number of dwellings, below the city average (5.8 citywide). The break-in trend is rising, so the gap with the city may narrow.
One caveat on the geography: 15.2% of criminal acts published for Montréal carry no location, so borough counts understate the real volume by a similar order.
Break-ins per 1,000 dwellings, all boroughs : 5.8
Housing stock
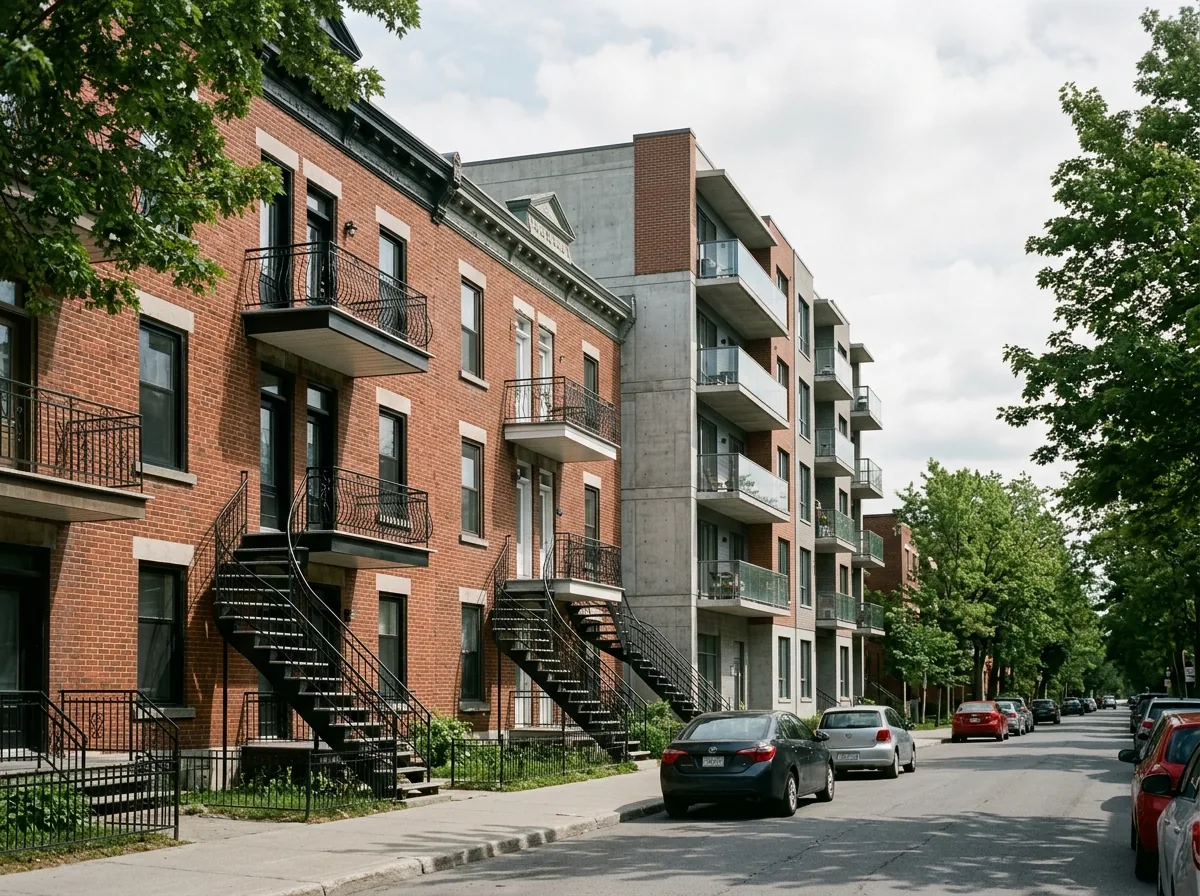
The assessment roll lists 20,606 dwellings in Anjou. Condominium units account for 18.5% of them, leaving rental buildings and single-family housing to carry most of the stock.
The median construction year is 1969, which places the typical building in the suburban expansion decades rather than the older core. Only 7.6% of dwellings predate that wave, so buyers here are more often looking at post-war apartment blocks, bungalows and later condo projects than at triplexes from the early part of the last century. Expect maintenance questions to centre on roofs, windows, plumbing stacks and electrical panels of that vintage.
What rent costs in the region
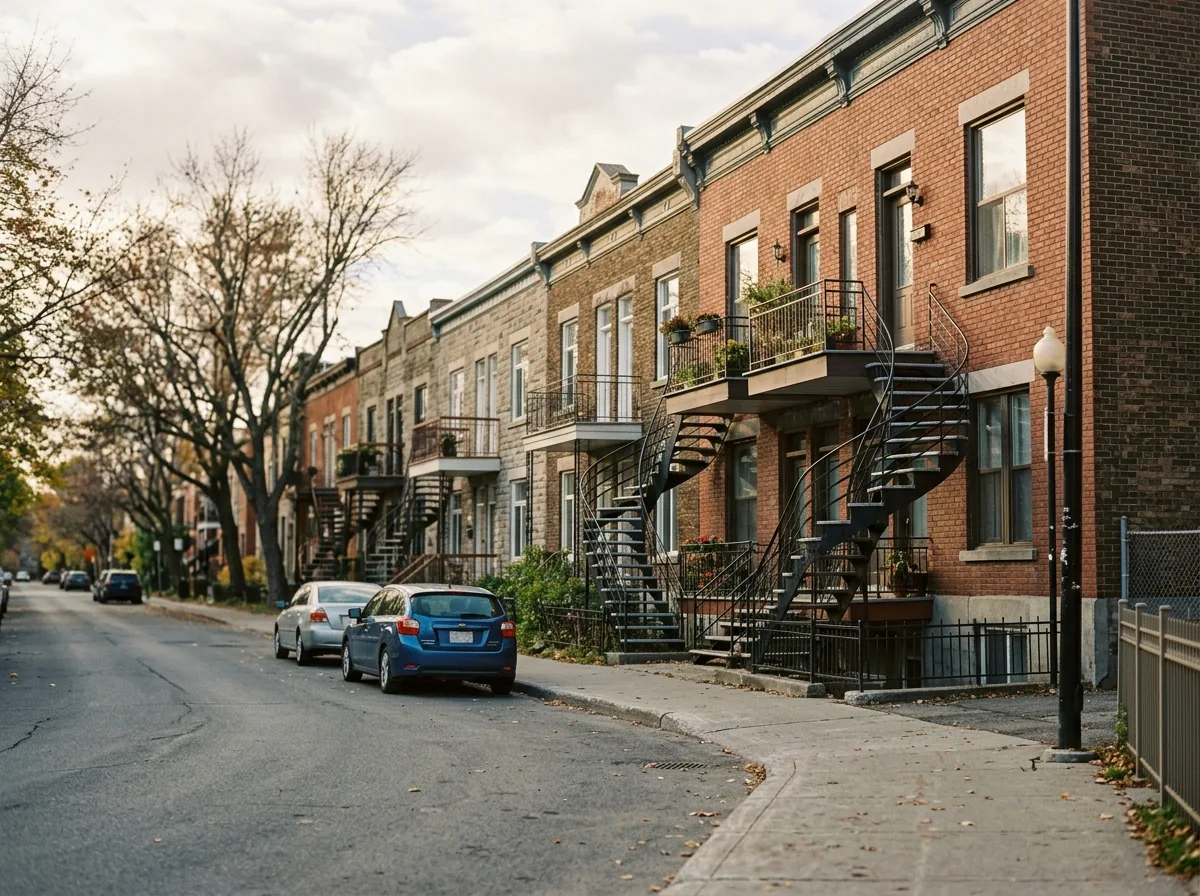
Rent figures published by CMHC cover the Montréal census metropolitan area, not Anjou on its own. There is no borough-level average in this dataset, so read the numbers as a regional benchmark rather than as local asking prices.
For the survey year 2025, the regional averages are $1,005 for a studio, $1,131 for a small apartment, $1,346 for a mid-size unit and $1,625 for the largest category. Actual listings in Anjou can land on either side of those marks depending on the building's age, parking and whether heating is included.
Practical notes for newcomers
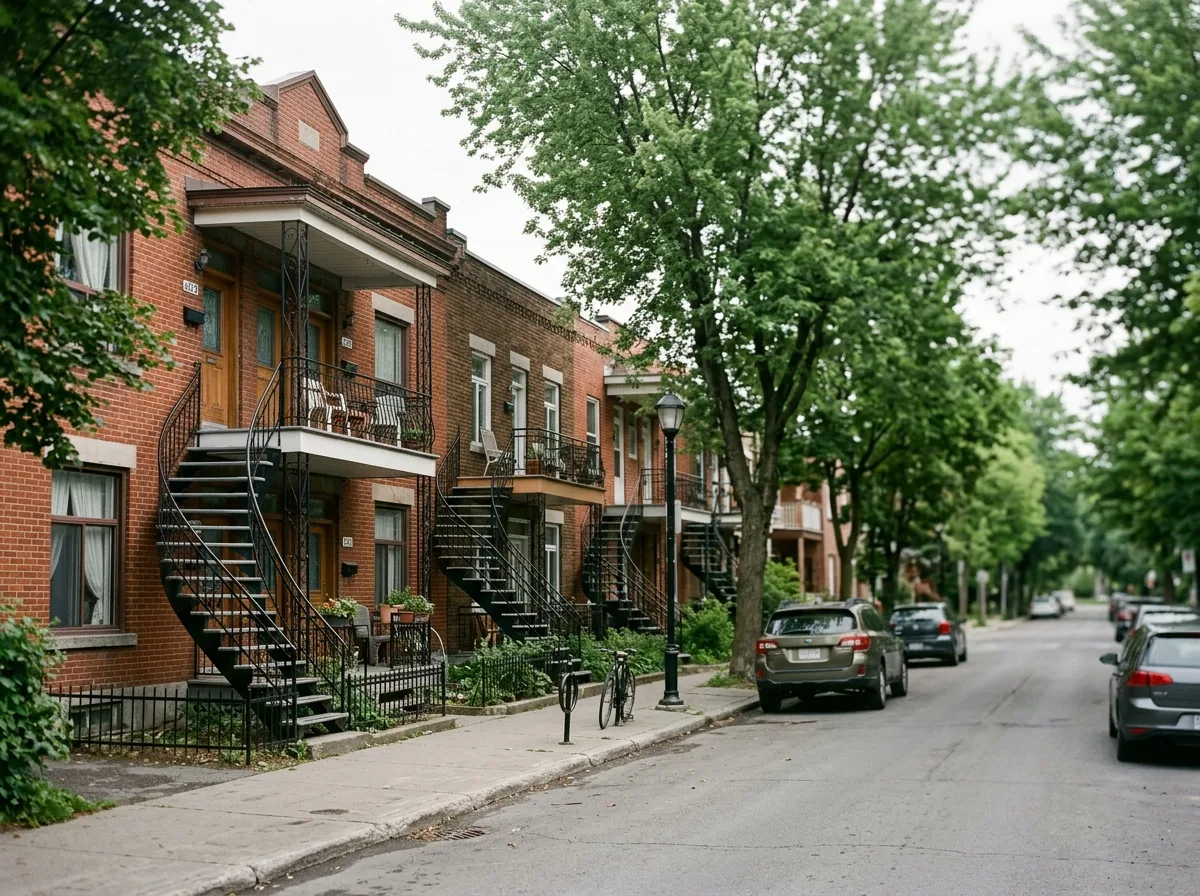
Given that vehicle thefts lead the local crime profile and break-ins are rising, parking habits matter here. A garage or a well-lit spot, a steering lock or tracker, and nothing visible inside the car go further than most other precautions. For the home itself, reinforced door strikes, a deadbolt and lighting on rear entrances are the low-cost basics; insurers sometimes adjust premiums for a monitored alarm, so ask before installing one.
When you shop for tenant or homeowner insurance, quotes are priced on the postal code rather than the borough, and a building's age influences them too, which is worth keeping in mind with a median construction year of 1969.
Buyers should get a mortgage pre-approval before touring, and budget for the welcome tax and inspection. With condominiums at 18.5% of the stock, read the contingency fund study and recent minutes before committing to one.
Frequently asked questions
Is Anjou a safe borough?
Crime in Anjou is close to the city average: 22.4 located acts relative to the number of dwellings, compared with 23.6 for all Montréal boroughs, and rank 13 counting up from the lowest. The trend is stable, with a change of -3.8% against the previous period.
How common are break-ins?
Police located 87 break-ins in Anjou over the most recent full year of data, or 4.2 relative to the number of dwellings. That is below the city average, where the figure is 5.8, though the local trend is rising.
How much is rent in Anjou?
No borough-specific average is published. For the Montréal census metropolitan area in 2025, CMHC reports $1,005 for a studio, $1,131 for a small apartment, $1,346 for a mid-size unit and $1,625 for the largest category. Treat these as regional context.
All the data
| Indicator | Value | Source |
|---|---|---|
| Break-ins (last 12 months) Period : 2025-09-01 → 2026-08-31 | 87 | Criminal acts |
| Break-ins compared with the city Period : 2025-09-01 → 2026-08-31 | below the city average | Criminal acts |
| Break-ins per 1,000 dwellings Period : 2025-09-01 → 2026-08-31 | 4.2 | Criminal acts |
| Year-over-year break-in trend Period : 2025-09-01 → 2026-08-31 | rising | Criminal acts |
| Share of dwellings in condominiums | 18.5% | Property assessment units |
| Year-over-year change in criminal acts Period : 2025-09-01 → 2026-08-31 | -3.8% | Criminal acts |
| Crime rate compared with the city Period : 2025-09-01 → 2026-08-31 | close to the city average | Criminal acts |
| Rank by crime rate (1 = lowest) Period : 2025-09-01 → 2026-08-31 | 13 | Criminal acts |
| Criminal acts per 1,000 dwellings Period : 2025-09-01 → 2026-08-31 | 22.4 | Criminal acts |
| Year-over-year crime trend Period : 2025-09-01 → 2026-08-31 | stable | Criminal acts |
| Located criminal acts (last 12 months) Period : 2025-09-01 → 2026-08-31 | 462 | Criminal acts |
| Located criminal acts (previous 12 months) Period : 2024-09-01 → 2025-08-31 | 480 | Criminal acts |
| Dwellings on the assessment roll | 20,606 | Property assessment units |
| Median construction year | 1969 | Property assessment units |
| Dwellings built before 1960 | 7.6% | Property assessment units |
| Most frequent category Period : 2025-09-01 → 2026-08-31 | vehicle thefts | Criminal acts |
| Share of the most frequent category Period : 2025-09-01 → 2026-08-31 | 27.3% | Criminal acts |
Regional context
| Indicator | Value | Source |
|---|---|---|
| Boroughs covered | 19 | Administrative boundaries of the agglomeration |
| Break-ins per 1,000 dwellings, all boroughs Period : 2025-09-01 → 2026-08-31 | 5.8 | Criminal acts |
| Criminal acts per 1,000 dwellings, all boroughs Period : 2025-09-01 → 2026-08-31 | 23.6 | Criminal acts |
| Average rent, Montréal CMA: one bedroom Period : 2025 | $1,131 | Average rents (Rental Market Survey) |
| Average rent, Montréal CMA: two bedrooms Period : 2025 | $1,346 | Average rents (Rental Market Survey) |
| Average rent, Montréal CMA: three bedrooms or more Period : 2025 | $1,625 | Average rents (Rental Market Survey) |
| Average rent, Montréal CMA: bachelor Period : 2025 | $1,005 | Average rents (Rental Market Survey) |
| Rent survey year | 2025 | Average rents (Rental Market Survey) |
| Share of criminal acts published without a location Period : 2025-09-01 → 2026-08-31 | 15.2% | Criminal acts |
Comments
No comments yet.